There is a huge difference between telling a customer «"Your car now has 30 more horsepower."» and show him the graph that proves it.. The dyno is the tool that turns a promise into measurable data. And for a chiptuning workshop, knowing how to use and interpret it is a huge competitive advantage.
You don't need your own dyno to benefit from this guide—many workshops take cars to an external dyno to validate their work. The important thing is understanding what the graphs measure, what the numbers mean, and how to use them to sell more and better. 🎯
🔬 How a power bank works
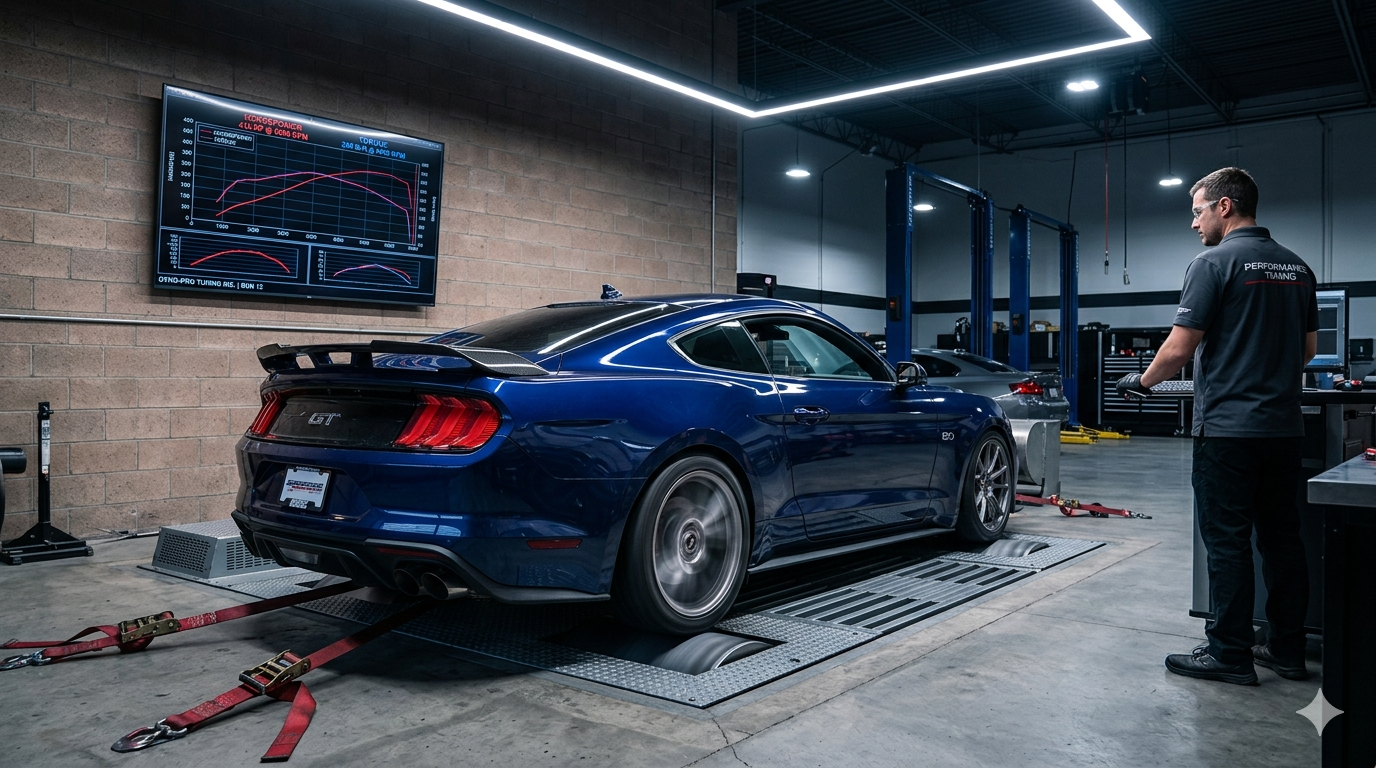
A chassis dyno measures the power and torque delivered to the drive wheels. The car is placed with its wheels on rollers that provide controlled resistance. The engine is revved to full power (WOT) while the rollers measure the force exerted by the wheels.
Based on that strength, the bank's software calculates:
- Wheel Horsepower (WHP): The actual horsepower that reaches the asphalt, discounting transmission losses
- Wheel Torque (WTQ): The rotational force in Nm that reaches the wheels
- Estimated crankshaft power (BHP/PS): A correction factor (~15-20% for front-wheel drive, ~20-25% for AWD) is applied to estimate engine power. This value is comparable to the manufacturer's data.
💡 Important: The data from power gains that are published They usually refer to estimated power at the crankshaft, not at the wheel. When comparing results, make sure you're comparing the same data.
📊 How to read a dyno sheet (power graph)
The dyno chart is your sales weapon and your diagnostic tool. This is what you're seeing:
The axes
- X-axis (horizontal): Engine RPM, normally from 1,500 at cutoff (6,000-7,500 depending on the engine)
- Left Y-axis: Power in CV (or HP/PS/kW depending on the dynamometer software)
- Right Y-axis: Torque in Nm
The curves
🔴 Power curve (usually red): The power curve rises gradually with the RPMs until it reaches a peak (maximum power) and then drops slightly. In a healthy engine, the curve is smooth and progressive. Irregularities, "sawtooth" patterns, or sudden drops indicate problems (fuel cut-off, excessive turbo lag, knock retard).
🔵 Torque curve (usually blue): It rises rapidly at low-to-mid RPMs, peaking before the power output (typically 1,500-3,500 RPM in diesel, 2,500-5,000 RPM in turbocharged gasoline engines) and then gradually declines. A remapped engine has a higher torque peak and a wider plateau.
When you overlay the graph of stock vs reprogrammed, The visual difference is immediate: the mod's red curve is higher than the stock curve across the entire RPM range where the maps have been modified. That area between the two curves is your visible work. It's exactly what the EcuTracer power calculator when generating Stage 1 graphs.
🔍 What to look for in the graph (warning signs)
The dyno isn't just for showing off your CV. It's a tool for diagnosis which complements the data log. These signals on the graph indicate problems:
⚠️ Sudden drop in power at high RPMs: It may indicate that the turbo pressure is dropping (wastegate opening prematurely), that the engine is going into knock protection mode, or that the injectors are not delivering more flow.
⚠️ Torque curve with "sawtooth" pattern: This indicates injection cuts or torque limiter intervention. If you see this after reprogramming, the file needs adjustment to the torque limiters or diagnostic maps.
⚠️ Wheel power well below expectations: Before blaming the file, check for transmission leaks. A slipping clutch (especially in DSG DQ200 with more torque than expected) absorbs power that does not reach the roller.
⚠️ Excessive difference between passes: If you do three consecutive runs and the power drops 10-15 hp between the first and third, the engine is entering thermal protection mode. This could be due to a cooling problem, an insufficient intercooler, or simply that the air in the room is too hot.
Each of these signals can then be investigated with a detailed data log. The article on how to create a data log It covers the entire process.
🚗 How to prepare a car for the bank
A poorly prepared dyno run provides useless data. Before putting the car on the dyno:
- ✅ Engine at operating temperature — Minimum 80°C refrigerant. No cold runs.
- ✅ Deposit at least half — with low fuel, the pump may cavitate at full load
- ✅ No active DTCs — any error code can cause the ECU to enter safe mode and cut power
- ✅ Tires properly inflated — Pressure affects contact with the roller and can alter the reading.
- ✅ Air conditioning off — consumes 3-5 HP from the engine
- ✅ Sport mode / more aggressive — If the car has driving modes, put it in the most permissive one so the ECU doesn't cut power delivery
- ✅ Fan pointing towards the front —essential for the intercooler to work. Without a fan, intake temperatures rise and the ECU cuts boost.
💡 Ideal protocol: Do 2-3 stock engine runs (save the best one), apply the remap, let the engine cool for 10 minutes, and do 2-3 post-remap runs. Overlap the best results from each set. This comparison is your working test.
💰 The power bank as a sales tool
Here's the gem that many workshops don't exploit: The dyno sheet is your best selling point.
📸 Content for social media: A photo of the car on the bench plus a graph showing stock vs. remapped CVs generates more engagement than any other post. Ask the customer for permission and share it. It's social proof that your work is effective.
📄 Power certificate: Deliver to the customer a copy of the dyno chart along with the digital reprogramming certificate. It's an extra that costs nothing and greatly enhances the perception of professionalism.
🤝 Sales closing: If you have a dyno nearby and a hesitant customer, offer them: «"We'll run a stock scan, show you the numbers, reprogram it, run another scan, and you'll see the difference on the screen. If you're not convinced, we'll go back to stock."» With the guarantee of reversibility, It is a risk-free proposal for the client.
📊 Price justification: When a customer tells you another shop charges less, show them dyno charts of your work. If the other shop doesn't have them, the conversation ends there. The numbers don't lie. More on how to justify your price in the complete guide.
⚡ Do you need your own bank?
Not necessarily. A roller rig costs between €15,000 and €50,000+ depending on the type and brand (Dynojet, Maha, Superflow). It's a significant investment that's justified if you perform more than 5-10 reprogrammings per week and want to offer in-house validation services.
If your volume is smaller, the smart option is to have an agreement with a nearby bank. Many dyno centers charge €50-100 per session. If you include that session in the reprogramming price (or offer it as an extra for €80-120), you're providing a premium service that justifies a higher price and builds trust.
What you should master, whether you have a bank or not, is the ECU map interpretation to understand exactly what your supplier modifies and how that translates into the dyno curves.
🔧 Do you want files that deliver real results at the bank? At EcuTracer we calibrate with over 25 years of experience and the data proves it. Original file included + free revisions for life. Register as a partner workshop.